
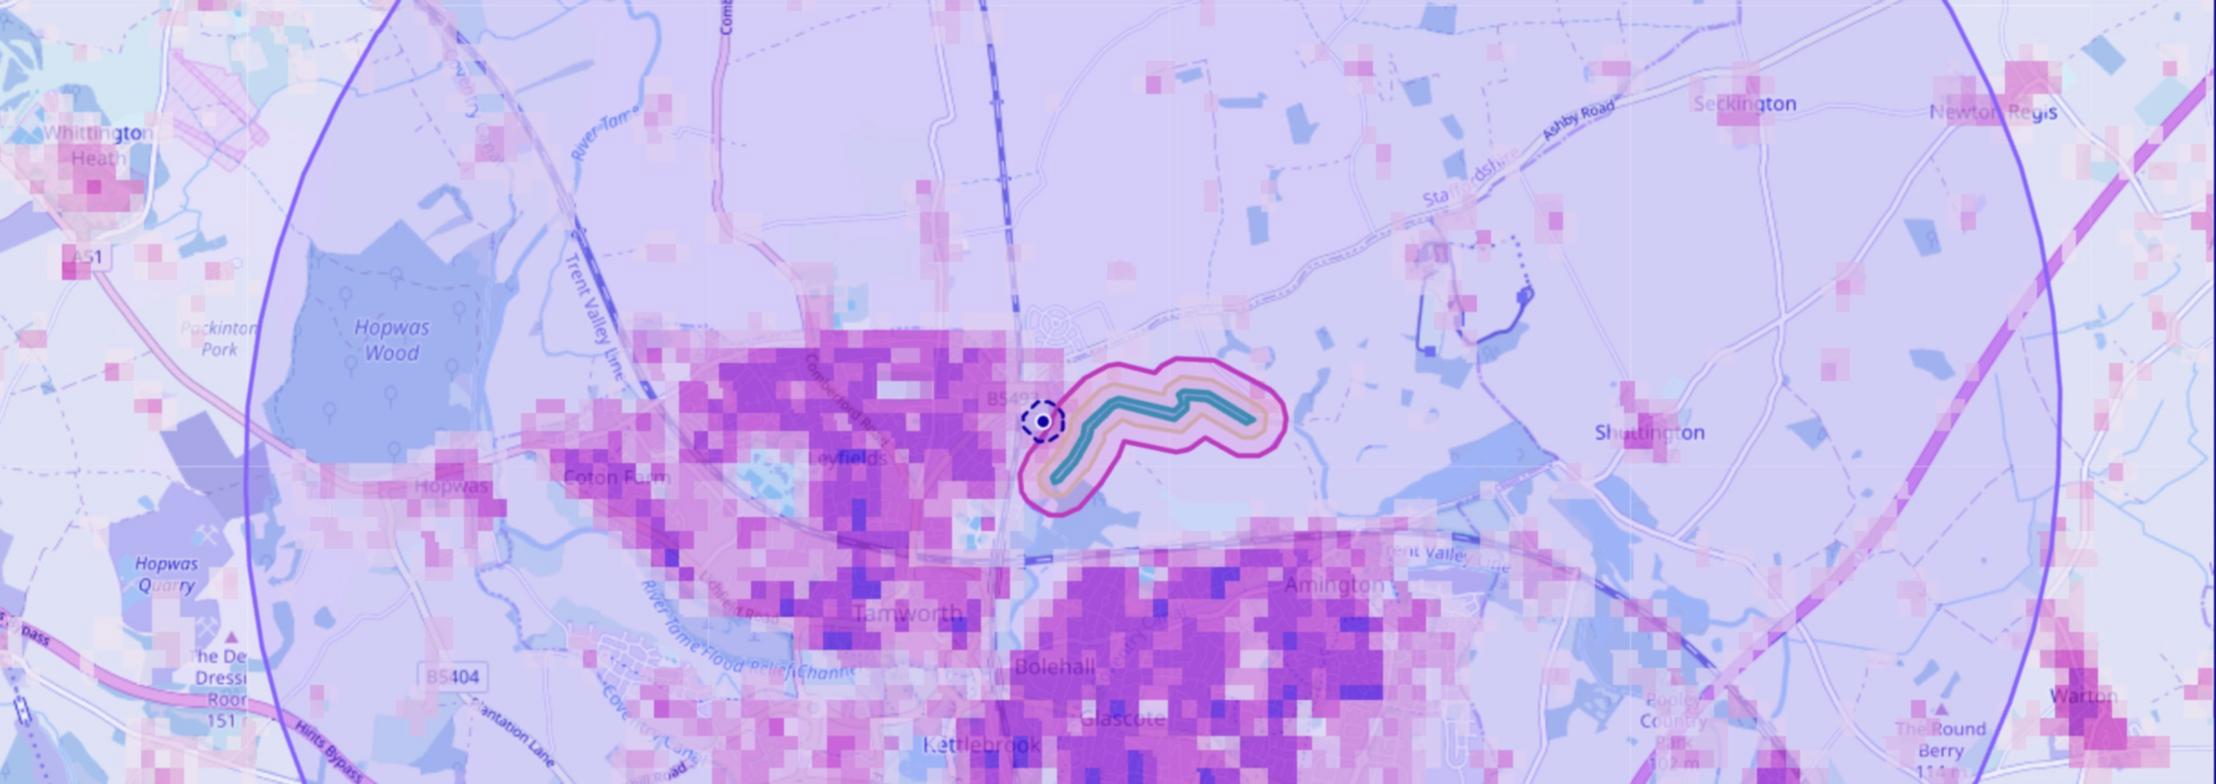

The UK’s SORA application process for enhanced drone permissions has to answer one deceptively simple question: how many people are on the ground beneath and around the flight? Our free UK SORA Population Calculator answers it in about a minute, from your flight plan, and gives you a branded PDF report to back it up.
The question every SORA application must answer
If you’re applying to the CAA for an operation in the Specific category, you’ll be working through SORA, the Specific Operations Risk Assessment. A big part of SORA is ground risk: if something goes wrong, who could the drone come down on?
That ground risk depends heavily on population density, the number of people per square kilometre. It decides your intrinsic Ground Risk Class, which feeds directly into the level of assurance the CAA will expect from you. Get the density wrong and you either over-engineer your application or, worse, under-state the risk.
Working it out by hand is fiddly. It means finding the right population data, drawing buffers around your flight area in mapping software, handling map projections correctly, and doing the sums twice: once for the area you’ll actually fly in, and once for the wider area around it.
What the tool does
You bring your flight plan; the calculator does the mapping and the maths. In practice it takes four steps:
- Load your flight area. Upload the KML or KMZ file of your flight geography, the area you plan to fly in. Most planning tools and Google Earth can export one.
- Add your buffers. Enter your contingency volume and ground risk buffer in metres, and the height you’ll fly at. The map immediately shows each area in its own colour: green for the flight geography, yellow for the contingency volume, red for the ground risk buffer and purple for the adjacent area.
- Click Calculate. The tool reads the population data for your site and works out the figures SORA asks for.
- Download your report. A branded, two-to-three page PDF sets out the results, maps, method and data sources, ready to attach to your application.
You get two headline numbers, each shown with the SORA population band it falls into:
- Operational area: the maximum population density across the flight geography, contingency volume and ground risk buffer. This is the figure used to set your intrinsic Ground Risk Class.
- Adjacent area: the average population density in the wider area around your operation, out to 5 km beyond the contingency volume. This matters for the containment requirements.
Your flight files never leave your computer. All the calculations happen in your own browser, and nothing about your operation is uploaded to us.
How it works, in plain terms
It uses up-to-date, official data. The core is the European Commission’s GHS-POP population grid for 2025, which estimates how many people live in each 100 m square across the UK. You can add two further sources with a tick-box:
- Ordnance Survey addresses (OS Open UPRN): every addressable property in Great Britain. This picks up detail the 100 m grid can smooth over, such as a row of terraced houses right on the edge of your buffer.
- Department for Transport traffic counts: an estimate of the people in vehicles on nearby motorways, A and B roads at the busiest hour.
Where two sources estimate residents, the tool takes the higher figure by default. That’s the cautious choice assessors expect.
It finds the busiest spot, not just the average. Averaging over your whole operational area can hide a small, dense patch, such as a housing estate at one end of a long corridor. So the tool slides a circle across the area, sized to how far a falling drone could scatter at your flying height, and reports the highest density it finds. This follows the sliding-window method in the SORA guidance (JARUS Annex F, section 3.9.1), and the map marks exactly where that maximum occurs.
It gets the geography right. Flight plans, maps and population grids all use different coordinate systems. The tool converts between them properly and does its measuring in British National Grid metres, so a 50 m buffer really is 50 m.
It’s been checked. We tested the results against the same steps run in QGIS, the industry-standard mapping software, and against independent calculations. They agree to within a fraction of a percent.
How it helps your SORA application
- Hours become minutes. No GIS software, no data downloads, no spreadsheets. Load a file, set your buffers and you have your figures.
- Try options before you commit. Change the buffer or flying height and the map redraws instantly. You can quickly see whether moving the flight area slightly, or flying lower, would drop you into a lower population band.
- Spot the risky corners early. The map shows exactly where the busiest part of your area is. That might be a reason to adjust your flight geography, or a point to address in your mitigations.
- Evidence you can stand behind. The PDF report shows your figures alongside the method, the data sources and their versions, and maps of every area. An assessor can follow exactly how each number was reached.
- Consistency across applications. Every site is assessed the same way, which makes a portfolio of applications easier to prepare and easier to defend.
What it doesn’t do
The calculator gives you robust, well-sourced numbers, but it’s a tool to support your assessment, not a replacement for it.
- The figures are estimates. Population grids are modelled from census and building data, and mostly show where people live rather than where they are at a given moment.
- Gatherings aren’t included. Markets, sports fixtures, school runs and events can bring far more people to a place than the figures suggest. You still need to check the local picture.
- The CAA makes the final call. Your assessor may ask how you’ve interpreted parts of the guidance, so it helps to understand the choices behind the numbers.
Try it, and get help if you need it
The UK SORA Population Calculator is free to use. Sign in with your email, load your flight area and you’ll have your figures and report in minutes. Try the calculator.
Population density is only one part of a SORA application. Leaping Wing also offers consultancy to help operators through the whole process, from defining your operational volumes and ground risk buffers to choosing mitigations and preparing your submission to the CAA. If you’d like support with an application, get in touch.